| Scenario: World oil climbs to 65 million barrels/day around the year 2000 and then declines to 40 million barrels/day by the year 2020. | |||
| Objective: PV will meet 20% of the oil shortfall by the year 2020 | |||
Assumptions
|
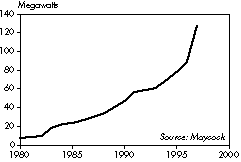
 Actual growth over the past several years. The growth rate required to meet these assumptions was met for the first time in 1997. | ||
Calculations
| |||
| Conclusion: Required Growth Rate of Industrial Capacity = 39% per year | |||
| #Years | Year | Manufacturing Capacity GigaWatts | Cumulative Installed GigaWatts |
| 0 | 1995 | 0.08 | 0.68 |
| 1 | 1996 | 0.11 | 0.79 |
| 2 | 1997 | 0.15 | 0.95 |
| 3 | 1998 | 0.21 | 1.16 |
| 4 | 1999 | 0.30 | 1.46 |
| 5 | 2000 | 0.41 | 1.87 |
| ... continuing in like fashion ... | |||
| 10 | 2005 | 2.14 | 8.04 |
| ................ | |||
| 20 | 2015 | 57 | 205 |
| 21 | 2016 | 80 | 285 |
| 22 | 2017 | 111 | 396 |
| 23 | 2018 | 154 | 550 |
| 24 | 2019 | 214 | 764 |
| 25 | 2020 | 297 | 1,062 |
|---|---|---|---|
| 1,062 GW ÷ 8 Billion population = 133 Watts per capita | |||

